Former UK Parliamentary constituency, 1950–1983
| Morecambe and Lonsdale |
|---|
Former county constituency
for the House of Commons |
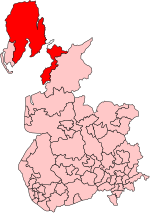 Morecambe and Lonsdale in Lancashire, showing boundaries used from 1974-1983 |
| 1950–1983 |
|---|
| Seats | one |
|---|
| Created from | Lancaster and Lonsdale |
|---|
| Replaced by | Morecambe & Lunesdale, Westmorland & Lonsdale and Barrow & Furness[1] |
|---|
Morecambe and Lonsdale was a constituency of the British House of Commons which existed until 1983.
Following the reorganisation of local government in England in the 1970s, a successor constituency called Morecambe and Lunesdale was formed. This followed the formation of Cumbria as a county council.
Before 1950, Morecambe was in the Lancaster constituency.
Boundaries
In the 1950s, the seat of Morecambe and Lonsdale incorporated Morecambe, Heysham, Carnforth, and the communities with Ulverston Rural District, which included Grange-over-Sands, Ulverston, Pennington, Satterthwaite, Hawkshead and Coniston[2]
Members of Parliament
Results
Elections in the 1950s
General election 1950: Morecambe and Lonsdale [4] | Party | Candidate | Votes | % | ±% |
| | Conservative | Ian Fraser | 28,041 | 60.3 | |
| | Labour | Albert Gaskell | 12,768 | 27.4 | |
| | Liberal | Gerard de Pfyffer Leeming | 5,723 | 12.3 | |
| Majority | 15,273 | 32.9 | |
| Turnout | 46,532 | 84.5 | |
| | Conservative win (new seat) |
General election 1951: Morecambe and Lonsdale [5] | Party | Candidate | Votes | % | ±% |
| | Conservative | Ian Fraser | 31,211 | 69.5 | +9.2 |
| | Labour | Ernest Gardner | 13,732 | 30.5 | +3.1 |
| Majority | 17,479 | 39.0 | +6.1 |
| Turnout | 44,943 | 80.4 | −4.1 |
| | Conservative hold | Swing | | |
General election 1955: Morecambe and Lonsdale | Party | Candidate | Votes | % | ±% |
| | Conservative | Ian Fraser | 29,706 | 71.2 | +1.7 |
| | Labour | Wilfred Fielding | 12,005 | 28.8 | −1.7 |
| Majority | 17,701 | 42.4 | +3.5 |
| Turnout | 41,711 | 74.5 | −5.9 |
| | Conservative hold | Swing | | |
General election 1959: Morecambe and Lonsdale | Party | Candidate | Votes | % | ±% |
| | Conservative | Basil de Ferranti | 30,228 | 70.0 | +4.7 |
| | Labour | Frank R McManus | 14,523 | 32.0 | −2.7 |
| Majority | 15,975 | 36.0 | +5.4 |
| Turnout | 44,751 | 77.2 | |
| | Conservative hold | Swing | | |
Elections in the 1960s
General election 1966: Morecambe and Lonsdale | Party | Candidate | Votes | % | ±% |
| | Conservative | Alfred Hall-Davis | 24,138 | 51.91 | |
| | Labour | Ivan Limmer | 13,838 | 29.76 | |
| | Liberal | David M Clark | 8,526 | 18.33 | New |
| Majority | 10,300 | 22.15 | |
| Turnout | 37,976 | 76.53 | |
| | Conservative hold | Swing | | |
Elections in the 1970s
General election 1970: Morecambe and Lonsdale | Party | Candidate | Votes | % | ±% |
| | Conservative | Alfred Hall-Davis | 27,442 | 56.99 | |
| | Labour | Eric Garbutt | 13,916 | 28.90 | |
| | Liberal | Anthony W Drury | 6,792 | 14.11 | |
| Majority | 13,526 | 28.09 | |
| Turnout | 48,150 | 72.55 | |
| | Conservative hold | Swing | | |
General election 1979: Morecambe and Lonsdale | Party | Candidate | Votes | % | ±% |
| | Conservative | Mark Lennox-Boyd | 29,068 | 55.40 | |
| | Labour | G Collier | 13,253 | 25.26 | |
| | Liberal | HR Tinker | 10,150 | 19.34 | |
| Majority | 15,815 | 30.14 | |
| Turnout | 52,471 | 76.46 | |
| | Conservative hold | Swing | | |
References
- ^ "'Morecambe and Lonsdale', Feb 1974 - May 1983". ElectionWeb Project. Cognitive Computing Limited. Archived from the original on 3 April 2016. Retrieved 23 March 2016.
- ^ Vision of Britain - Morecambe and Lonsdale map
- ^ Leigh Rayment's Historical List of MPs – Constituencies beginning with "M" (part 3)
- ^ "Politicsresources.net - Official Web Site ✔". 12 October 2022.
- ^ "Politicsresources.net - Official Web Site ✔". 12 October 2022.


