2024 English local election
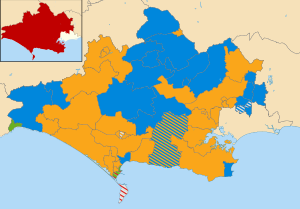
The 2024 Dorset Council election took place on Thursday 2 May 2024 to elect all 82 councillors to Dorset Council in England, the same day as other local elections in the United Kingdom.[1]
Dorset Council was previously controlled by the Conservatives, who won the first election to the Council in 2019. The 2024 election was the last for a five-year term of office; after 2029, elections will take place every four years.[2]
The Liberal Democrats were aiming to gain control of the council from the Conservatives,[3] which they achieved.[4] The Liberal Democrat group leader, Nick Ireland, was subsequently appointed leader of the council at the annual council meeting on 16 May 2024.[5]
Wards
| Ward | Councillors |
| Beacon | 1 |
| Beaminster | 1 |
| Blackmore Vale | 1 |
| Blandford | 2 |
| Bridport | 3 |
| Chalk Valleys | 1 |
| Charminster St Mary's | 1 |
| Chesil Bank | 1 |
| Chickerell | 2 |
| Colehill and Wimborne Minster East | 2 |
| Corfe Mullen | 2 |
| Cranborne and Alderholt | 1 |
| Cranborne Chase | 1 |
| Crossways | 1 |
| Dorchester East | 2 |
| Dorchester Poundbury | 1 |
| Dorchester West | 2 |
| Eggardon | 1 |
| Ferndown North | 2 |
| Ferndown South | 2 |
| Gillingham | 3 |
| Hill Forts and Upper Tarrants | 1 |
| Littlemoor and Preston | 2 |
| Lyme and Charmouth | 1 |
| Lytchett Matravers and Upton | 3 |
| Marshwood Vale | 1 |
| Melcombe Regis | 1 |
| Portland | 3 |
| Puddletown and Lower Winterborne | 1 |
| Radipole | 2 |
| Rodwell and Wyke | 3 |
| Shaftesbury Town | 2 |
| Sherborne East | 1 |
| Sherborne Rural | 1 |
| Sherborne West | 1 |
| South East Purbeck | 1 |
| St Leonards and St Ives | 2 |
| Stalbridge and Marnhull | 1 |
| Stour and Allen Vale | 1 |
| Sturminster Newton | 1 |
| Swanage | 2 |
| Upwey and Broadwey | 1 |
| Verwood | 3 |
| Wareham | 2 |
| West Moors and Three Legged Cross | 2 |
| West Parley | 1 |
| West Purbeck | 2 |
| Westham | 2 |
| Wimborne Minster | 2 |
| Winterborne and Broadmayne | 1 |
| Winterborne North | 1 |
| Yetminster | 1 |
Overall results
| Results[6] |
| Party | Seats | Change |
| | Liberal Democrats | 42 |  13 13 |
| | Conservative Party | 30 |  13 13 |
| | Green | 4 |  |
| | Independents for Dorset | 4 | |
| | Labour | 2 | |
Seats changing hands
| Ward | Party before | Party after |
| Bridport | | Green | | Liberal Democrats |
| Chesil Bank | | Conservative | | Liberal Democrats |
| Chickerell | | Conservative | | Liberal Democrats |
| Chickerell | | Independent | | Liberal Democrats |
| Corfe Mullen | | Conservative | | Liberal Democrats |
| Gillingham | | Conservative | | Liberal Democrats |
| Lyme and Charmouth | | Conservative | | Green |
| Lytchett Matravers and Upton | | Conservative | | Liberal Democrats |
| South East Purbeck | | Conservative | | Liberal Democrats |
| Stour and Allen Vale | | Conservative | | Liberal Democrats |
| West Purbeck | | Conservative | | Liberal Democrats |
| Winterborne North | | Conservative | | Liberal Democrats |
| Yetminster | | Conservative | | Liberal Democrats |
Ward Results
Beacon
Beacon[7] | Party | Candidate | Votes | % | ±% |
| | Conservative | Jane Somper* | 898 | 61.3 | -3.1 |
| | Liberal Democrats | Claire Elizabeth Reed | 307 | 20.9 | -5.8 |
| | Labour | Gillian Clare Cross | 133 | 9.1 | +0.1 |
| | Green | Sheila Healy | 125 | 8.5 | New |
| Rejected ballots | 5 | 0.34 | |
| Turnout | 1,466 | 38.32 | |
| Registered electors | 3,826 | | |
| | Conservative hold | Swing | | |
Beaminster
Beaminster | Party | Candidate | Votes | % | ±% |
| | Conservative | Craig Monks | 601 | 42.9 | -4.8 |
| | Liberal Democrats | Paul David Fitzpatrick | 579 | 41.3 | +3.7 |
| | Labour | Julie Cook | 70 | 5.0 | +0.5 |
| | Reform UK | Yvonne Harris | 69 | 4.9 | New |
| | Green | Andy McEwen | 65 | 4.6 | -5.4 |
| | Independent | Richard Thomas Gunning | 17 | 1.2 | New |
| Turnout | 1,401 | 40.33 | |
| | Conservative hold | Swing | | |
Blackmore Vale
Blackmore Vale | Party | Candidate | Votes | % | ±% |
| | Conservative | Stephen Murcer | 637 | 50.3 | -11.5 |
| | Liberal Democrats | Ian Philip Suter | 468 | 37.0 | +22.4 |
| | Green | Vicki Elcoate | 161 | 12.7 | New |
| Turnout | 1,266 | 35.09 | |
| | Conservative hold | Swing | | |
Blandford
Blandford | Party | Candidate | Votes | % | ±% |
| | Conservative | Byron Robert Quayle* | 1,334 | 53.9 | -1.1 |
| | Conservative | Noc Lacey-Clarke* | 1,307 | 52.9 | +0.7 |
| | Liberal Democrats | Hugo Anthony Mieville | 756 | 30.6 | +3.6 |
| | Liberal Democrats | David Edwin Orton | 556 | 22.5 | -4.1 |
| | Labour | Gerald Davies | 279 | 11.3 | -6.5 |
| | Labour | Dennis Wardleworth | 259 | 10.5 | -2.1 |
| | Green | Lisa Willis | 123 | 5.0 | New |
| | Green | Pete West | 113 | 4.6 | New |
| | SDP | Daniel Paul Avery | 50 | 2.0 | New |
| | SDP | Linda Isobel Stenner | 31 | 1.3 | New |
| Turnout | 2,473 | 31.29 | |
| | Conservative hold | Swing | | |
| | Conservative hold | Swing | | |
Bridport
Bridport | Party | Candidate | Votes | % | ±% |
| | Liberal Democrats | Sarah Williams* | 1,726 | 41.5 | -0.8 |
| | Liberal Democrats | Dave Bolwell* | 1,646 | 39.6 | +6.3 |
| | Liberal Democrats | Bridget Bolwell | 1,587 | 38.2 | +18.2 |
| | Green | Kelvin Charles Clayton* | 1,562 | 37.6 | +1.7 |
| | Green | Julian Stephen Langton Jones | 1,166 | 28.0 | New |
| | Green | Bob Hamblett | 880 | 21.2 | New |
| | Conservative | Una Christopher | 832 | 20.0 | -6.2 |
| | Labour | Steven Rose | 760 | 18.3 | +1.0 |
| | Conservative | Anna Louise Cox | 754 | 18.1 | -7.3 |
| | Conservative | Frances Kathleen McKenzie | 747 | 18.0 | -5.3 |
| Turnout | 4,158 | 35.07 | |
| | Liberal Democrats hold | Swing | | |
| | Liberal Democrats gain from Green | Swing | | |
| | Liberal Democrats hold | Swing | | |
Chalk Valleys
Chalk Valleys | Party | Candidate | Votes | % | ±% |
| | Conservative | Jill Haynes | 683 | 48.0 | -2.4 |
| | Liberal Democrats | Iain Douglas Young | 554 | 38.9 | +17.1 |
| | Labour | John Bennett | 186 | 13.1 | New |
| Turnout | 1,423 | 36.99 | |
| | Conservative hold | Swing | | |
Charminster St Mary's
Charminster St Mary's | Party | Candidate | Votes | % | ±% |
| | Liberal Democrats | David Taylor* | 892 | 64.9 | +11.4 |
| | Conservative | Nigel McCrea | 483 | 35.1 | +5.3 |
| Turnout | 1,375 | 34.57 | |
| | Liberal Democrats hold | Swing | | |
Chesil Bank
Chesil Bank | Party | Candidate | Votes | % | ±% |
| | Liberal Democrats | Sally Anne Holland | 704 | 43.5 | +22.7 |
| | Conservative | Mark Roberts* | 482 | 29.8 | -9.4 |
| | Green | Peter Reid | 373 | 23.0 | -10.1 |
| | Labour | Richard Howard Nicholls | 61 | 3.8 | -3.1 |
| Turnout | 1,620 | 49.34 | |
| | Liberal Democrats gain from Conservative | Swing | | |
Chickerell
Chickerell | Party | Candidate | Votes | % | ±% |
| | Liberal Democrats | Gill Taylor | 891 | 49.2 | +29.5 |
| | Liberal Democrats | Simon Arthur Dewi Clifford | 729 | 40.3 | +24.7 |
| | Conservative | Jean Dunseith* | 690 | 38.1 | -4.2 |
| | Conservative | Andrew William MacLeod Reid | 570 | 31.5 | +1.6 |
| | Labour | Grafton Alphonso Straker | 329 | 18.2 | +3.0 |
| Turnout | 1,811 | 28.58 | |
| | Liberal Democrats gain from Conservative | Swing | | |
| | Liberal Democrats gain from Independent | Swing | | |
Colehill & Wimborne Minster East
Colehill & Wimborne Minster East | Party | Candidate | Votes | % | ±% |
| | Liberal Democrats | Andrew Thomas Todd | 1,275 | 48.0 | -9.4 |
| | Liberal Democrats | Jindy Atwal | 1,168 | 44.0 | +5.9 |
| | Conservative | KD Johnson | 940 | 35.4 | +1.0 |
| | Conservative | Carol Lynda Butter | 764 | 28.8 | +1.4 |
| | Independent | Emma Urquhart | 578 | 21.8 | New |
| | Labour | David Moore | 215 | 8.1 | +2.9 |
| Turnout | 2,656 | 36.72 | |
| | Liberal Democrats hold | Swing | | |
| | Liberal Democrats hold | Swing | | |
Corfe Mullen
Corfe Mullen | Party | Candidate | Votes | % | ±% |
| | Liberal Democrats | Duncan Sowry-House | 1,249 | 53.7 | +14.6 |
| | Liberal Democrats | Scott Florek | 1,145 | 49.3 | +1.6 |
| | Conservative | Mike Barron* | 641 | 27.6 | -20.1 |
| | Conservative | Penny Barron | 597 | 25.7 | -18.7 |
| | Independent | Lee Charles Hardy | 457 | 19.7 | New |
| | Labour | Graham Paul Hillman | 197 | 8.5 | +0.9 |
| Turnout | 2,324 | 29.03 | |
| | Liberal Democrats hold | Swing | | |
| | Liberal Democrats gain from Conservative | Swing | | |
Cranborne & Alderholt
Cranborne and Alderholt | Party | Candidate | Votes | % | ±% |
| | Liberal Democrats | Dave Tooke* | 678 | 53.7 | +7.0 |
| | Conservative | Adrian Hibberd | 508 | 40.2 | -5.3 |
| | Labour | Peter Parsons | 77 | 6.1 | -1.8 |
| Turnout | 1,263 | 32.33 | |
| | Liberal Democrats hold | Swing | | |
Cranborne Chase
Cranborne Chase | Party | Candidate | Votes | % | ±% |
| | Conservative | Piers Brown* | 634 | 65.4 | -0.2 |
| | Liberal Democrats | Tom Harding | 194 | 20.0 | New |
| | Labour | Louise Claire Cooper | 142 | 14.6 | -2.9 |
| Turnout | 970 | 30.24 | |
| | Conservative hold | Swing | | |
Crossways
Crossways | Party | Candidate | Votes | % | ±% |
| | Liberal Democrats | Nick Ireland* | 636 | 57.3 | -5.0 |
| | Conservative | Andrew Ross-Skinner | 361 | 32.5 | +2.4 |
| | Labour | Jim Draper | 113 | 10.2 | +2.6 |
| Turnout | 1,110 | 37.4 | |
| | Liberal Democrats hold | Swing | | |
Dorchester East
Dorchester East | Party | Candidate | Votes | % | ±% |
| | Liberal Democrats | Stella Jones* | 1,337 | 52.4 | -11.2 |
| | Liberal Democrats | Rory Major | 979 | 38.3 | -25.9 |
| | Green | Kate Hebditch | 825 | 32.3 | New |
| | Independents for Dorset | Katy Jones | 571 | 22.4 | New |
| | Conservative | Angus Christopher | 329 | 12.9 | -4.9 |
| | Conservative | Mina Bowater | 322 | 12.6 | -7.9 |
| | Labour | Barry Thompson | 304 | 11.9 | -1.6 |
| | Labour | Ash Mottaghi | 208 | 8.1 | -8.3 |
| Turnout | 2,553 | 38.54 | |
| | Liberal Democrats hold | Swing | | |
| | Liberal Democrats hold | Swing | | |
Dorchester Poundbury
Dorchester Poundbury | Party | Candidate | Votes | % | ±% |
| | Liberal Democrats | Richard Martin Biggs* | 780 | 54.0 | +18.1 |
| | Conservative | Peter Jonathon Stein | 449 | 31.1 | -1.5 |
| | Labour | Nick Boothroyd | 122 | 8.4 | +4.1 |
| | Green | Len Herbert | 93 | 6.4 | +0.7 |
| Turnout | 1,444 | 41.38 | |
| | Liberal Democrats hold | Swing | | |
Dorchester West
Dorchester West | Party | Candidate | Votes | % | ±% |
| | Independents for Dorset | Les Fry* | 1,335 | 58.5 | +19.6 |
| | Liberal Democrats | Andy Canning* | 1,322 | 57.9 | +13.2 |
| | Labour | Claudia Sorin | 580 | 25.4 | +14.8 |
| | Conservative | Jeremy Peel-Yates | 261 | 11.4 | -7.3 |
| | Labour | Andrew Charles Wyatt | 259 | 11.3 | +1.6 |
| | Conservative | Kevin Selby | 254 | 11.1 | -1.2 |
| Turnout | 2,282 | 34.06 | |
| | Independents for Dorset hold | Swing | | |
| | Liberal Democrats hold | Swing | | |
Eggardon
Eggardon | Party | Candidate | Votes | % | ±% |
| | Liberal Democrats | Neil Jeffrey Eysenck | 724 | 43.7 | +26.0 |
| | Conservative | Harry Coutts | 637 | 38.5 | -9.6 |
| | Green | Richard Edwards | 238 | 14.4 | -9.3 |
| | Labour | David Machin | 57 | 3.4 | -7.1 |
| Turnout | 1,656 | 41.08 | |
| | Liberal Democrats gain from Conservative | Swing | {{{swing}}} | |
Ferndown North
Ferndown North | Party | Candidate | Votes | % | ±% |
| | Conservative | Cathy Lugg* | 955 | 44.3 | -9.8 |
| | Conservative | Mike Parkes* | 794 | 36.8 | -13.3 |
| | Independent | Simon Lee Cable | 781 | 36.2 | New |
| | Independent | Philip Leach | 753 | 34.9 | New |
| | Liberal Democrats | Michael Adrian Clements | 304 | 14.1 | -9.7 |
| | Reform UK | Andrei Silviu Dragotoniu | 232 | 10.8 | New |
| | Liberal Democrats | Esbjörn Roderick Wilmar | 228 | 10.6 | -11.9 |
| Turnout | 2,156 | 29.62 | |
| | Conservative hold | Swing | | |
| | Conservative hold | Swing | | |
Ferndown South
Ferndown South | Party | Candidate | Votes | % | ±% |
| | Conservative | Julie Lorraine Robinson* | 684 | 38.6 | -0.3 |
| | Independent | Hannah Hobbs-Chell | 621 | 35.0 | New |
| | Conservative | George Phillips | 602 | 34.0 | -1.0 |
| | Independent | Lawrence Leslie Ralph Wilson | 556 | 31.4 | +6.6 |
| | Independent | Paul Hanson Graham | 367 | 20.7 | +1.8 |
| | Liberal Democrats | Susan Jefferies | 276 | 15.6 | -8.5 |
| | Liberal Democrats | Ross Alexander Bowell | 270 | 15.2 | New |
| Turnout | 1,773 | 26.45 | |
| | Conservative hold | Swing | | |
| | Independent hold | Swing | | |
Independent Gain from Conservative
Gillingham
Gillingham | Party | Candidate | Votes | % | ±% |
| | Conservative | Val Pothecary* | 1,549 | 42.5 | +1.9 |
| | Conservative | Belinda Brenda Louise Ridout* | 1,528 | 41.9 | -1.5 |
| | Liberal Democrats | Carl Anthony Woode | 1,490 | 40.9 | +10.9 |
| | Liberal Democrats | David Charles Thomas Fox | 1,444 | 39.6 | +16.5 |
| | Conservative | David Walsh* | 1,408 | 38.6 | -0.6 |
| | Liberal Democrats | Alex Percy | 1,402 | 38.4 | +19.9 |
| | Green | Angela Henshall | 554 | 15.2 | New |
| | Labour | Anna Marsh | 532 | 14.6 | +4.2 |
| Turnout | 3,647 | 30.19 | |
| | Conservative hold | Swing | | |
| | Conservative hold | Swing | | |
| | Liberal Democrats gain from Conservative | Swing | | |
Hill Forts & Upper Tarrants
Hill Forts & Upper Tarrants | Party | Candidate | Votes | % | ±% |
| | Conservative | Sherry Jesperson* | 709 | 55.4 | -5.1 |
| | Liberal Democrats | Joseph Roger Hickish | 251 | 19.6 | -4.2 |
| | Labour | Alan Cross | 168 | 13.1 | -2.6 |
| | Green | Keith Yarwood | 151 | 11.8 | New |
| Turnout | 1,279 | 36.47 | |
| | Conservative hold | Swing | | |
Littlemoor & Preston
Littlemoor & Preston | Party | Candidate | Votes | % | ±% |
| | Conservative | Louie James O'Leary* | 1,599 | 56.3 | +23.9 |
| | Conservative | Peter Dickenson* | 1,379 | 48.6 | +13.3 |
| | Liberal Democrats | Howard Richard Legg | 688 | 24.2 | +3.6 |
| | Liberal Democrats | Ann Weaving | 664 | 23.4 | +6.1 |
| | Independent | Alex Bailey | 439 | 15.5 | New |
| | Labour | Steve Brown | 408 | 14.4 | -9.2 |
| Turnout | 2,838 | 37.42 | |
| | Conservative hold | Swing | | |
| | Conservative hold | Swing | | |
Lyme & Charmouth
Lyme & Charmouth | Party | Candidate | Votes | % | ±% |
| | Green | Belinda Bawden* | 884 | 61.0 | +46.2 |
| | Conservative | Michaela Louise Ellis | 380 | 26.2 | -13.9 |
| | Liberal Democrats | Paddy Mooney | 103 | 7.1 | New |
| | Labour | David Hart | 83 | 5.7 | -7.0 |
| Turnout | 1,450 | 35.92 | |
| | Green gain from Conservative | Swing | | |
Lytchett Matravers & Upton
Lytchett Matravers & Upton | Party | Candidate | Votes | % | ±% |
| | Liberal Democrats | Steve Robinson | 1,356 | 50.7 | +17.0 |
| | Liberal Democrats | Alex Brenton* | 1,354 | 50.7 | +9.4 |
| | Liberal Democrats | Andrew James Starr* | 1,155 | 43.2 | -1.2 |
| | Conservative | Bill Pipe* | 1,073 | 40.2 | -5.2 |
| | Conservative | Sean Gabriel | 965 | 36.1 | -4.3 |
| | Conservative | Stew McKell | 928 | 34.7 | -3.4 |
| | Labour | John Patrick Billington | 363 | 13.6 | +3.9 |
| Turnout | 2,672 | 27.72 | |
| | Liberal Democrats gain from Conservative | Swing | | |
| | Liberal Democrats hold | Swing | | |
| | Liberal Democrats hold | Swing | | |
Marshwood Vale
Marshwood Vale | Party | Candidate | Votes | % | ±% |
| | Conservative | Simon John Christopher | 645 | 39.8 | +0.8 |
| | Green | Jacqui Sewell | 525 | 32.4 | +1.5 |
| | Liberal Democrats | Jane Gregory | 340 | 21.0 | +11.3 |
| | Labour | Steve Chapman | 109 | 6.7 | +2.3 |
| Turnout | 1,619 | 41.37 | |
| | Conservative hold | Swing | | |
Melcombe Regis
Melcombe Regis | Party | Candidate | Votes | % | ±% |
| | Green | Jon Orrell* | 419 | 49.2 | -13.6 |
| | Conservative | Claire Wall | 256 | 30.1 | +10.1 |
| | Labour | Howard John Atkinson | 176 | 20.7 | +3.4 |
| Turnout | 851 | 26.01 | |
| | Green hold | Swing | | |
Portland
Portland | Party | Candidate | Votes | % | ±% |
| | Independents for Dorset | Pete Roper | 899 | 35.6 | New |
| | Independents for Dorset | Rob Hughes* | 895 | 35.5 | -1.8 |
| | Labour | Paul Ralph Kimber* | 875 | 34.7 | +2.5 |
| | Green | Catherine Bennett | 785 | 31.1 | +6.4 |
| | Independents for Dorset | Susan Cocking* | 744 | 29.5 | -2.2 |
| | Labour | Carralyn Paula Parkes | 724 | 28.7 | -1.3 |
| | Labour | Bernard Edward Parkes | 546 | 21.6 | -2.3 |
| | Conservative | Margaret Caroline Gadd | 342 | 13.6 | -12.3 |
| | Conservative | Ian Munro-Price | 244 | 9.7 | -14.4 |
| | Conservative | Maureen Quinn | 224 | 8.9 | -11.3 |
| | Liberal Democrats | Holly Hope | 120 | 4.8 | New |
| | Liberal Democrats | Lee Daniel Harmsworth | 75 | 3.0 | New |
| | Liberal Democrats | Gillian Pearson | 74 | 2.9 | New |
| Turnout | 2,522 | 27.24 | |
| | Independents for Dorset hold | Swing | | |
| | Independents for Dorset hold | Swing | | |
| | Labour hold | Swing | | |
Puddletown & Lower Winterborne
Puddletown & Lower Winterborne | Party | Candidate | Votes | % | ±% |
| | Conservative | Emma Jayne Parker* | 603 | 46.3 | -2.2 |
| | Liberal Democrats | James Henry Lloyd | 456 | 35.0 | +11.1 |
| | Labour | Helen Badger | 243 | 18.7 | +6.9 |
| Turnout | 1,302 | 30.74 | |
| | Conservative hold | Swing | | |
Radipole
Radipole | Party | Candidate | Votes | % | ±% |
| | Liberal Democrats | Matt Bell | 1,427 | 64.3 | +13.0 |
| | Liberal Democrats | Louise Brown | 1,123 | 50.6 | +3.6 |
| | Labour | Pauline Crump | 486 | 21.9 | +1.3 |
| | Conservative | George Granycome | 464 | 20.9 | -6.1 |
| | Conservative | James William Farquharson | 457 | 20.6 | -5.0 |
| Turnout | 2,220 | 30.66 | |
| | Liberal Democrats hold | Swing | | |
| | Liberal Democrats hold | Swing | | |
Rodwell & Wyke
Rodwell & Wyke | Party | Candidate | Votes | % | ±% |
| | Green | Clare Sutton* | 1,516 | 44.9 | -4.5 |
| | Labour | Kate Wheller* | 1,385 | 41.0 | +6.9 |
| | Green | Claudia Lucienne Webb | 1,327 | 39.3 | +8.7 |
| | Green | Valerie Jane Graves | 1,199 | 35.5 | +9.7 |
| | Labour | Antony Prowse | 914 | 27.1 | +3.6 |
| | Conservative | Caroline Joyce Nickinson | 825 | 24.4 | +3.4 |
| | Conservative | Richard Douglas Nickinson | 756 | 22.4 | +0.2 |
| | Labour | Thomas Taylor | 700 | 20.7 | +0.5 |
| | Conservative | Clare Louise Williams | 644 | 19.1 | -1.2 |
| Turnout | 3,377 | 31.69 | |
| | Green hold | Swing | | |
| | Labour hold | Swing | | |
| | Green hold | Swing | | |
Shaftesbury Town
Shaftesbury Town | Party | Candidate | Votes | % | ±% |
| | Liberal Democrats | Derek Leslie Beer* | 1,403 | 60.1 | +9.5 |
| | Liberal Democrats | Jack David John Jeanes | 1,008 | 43.2 | +13.9 |
| | Conservative | Virginia Edwyn-Jones | 558 | 23.9 | +3.3 |
| | Independent | Andrew Reginald Hollingshead | 529 | 22.7 | +7.2 |
| | Conservative | Barry von Clemens | 269 | 11.5 | -4.9 |
| | Labour | Dan Bavister | 233 | 10.0 | +0.8 |
| | No Description | Lester Mark Dibben | 187 | 8.0 | +1.7 |
| | Patriots Alliance (English Democrats and UKIP) | Steve Unwin | 118 | 5.1 | -4.9 |
| | Patriots Alliance (English Democrats and UKIP) | Lester Taylor | 86 | 3.7 | -7.0 |
| Turnout | 2,335 | 34.40 | |
| | Liberal Democrats hold | Swing | | |
| | Liberal Democrats hold | Swing | | |
Sherborne East
Sherborne East[7] | Party | Candidate | Votes | % | ±% |
| | Liberal Democrats | Jon Andrews * | 838 | 58.1 | +8.5 |
| | Conservative | Juliet May Pentolfe | 502 | 34.8 | –1.4 |
| | Green | Robert Sean Casey | 103 | 7.1 | ±0.0 |
| Majority | 336 | 23.3 | +9.9 |
| Registered electors | 3,777 | | |
| Turnout | 1,443 | 38.76 | –5.74 |
| | Liberal Democrats hold | Swing | +9.2 | |
Sherborne Rural
Sherborne Rural[7] | Party | Candidate | Votes | % | ±% |
| | Liberal Democrats | Robin Andrew Shane Legg * | 916 | 60.3 | +6.9 |
| | Conservative | Stephen Hillier | 604 | 39.7 | +5.2 |
| Majority | 312 | 20.5 | |
| Registered electors | 4,036 | | |
| Turnout | 1,520 | 38.11 | –4.59 |
| | Liberal Democrats hold | Swing | +0.9 | |
Sherborne West
Sherborne West[7] | Party | Candidate | Votes | % | ±% |
| | Liberal Democrats | Richard Henry Geoffrey Crabb * | 575 | 43.9 | –9.7 |
| | Conservative | Rebecca Burns | 471 | 36.0 | –2.0 |
| | Independent | Taff Martin | 264 | 20.2 | New |
| Majority | 104 | 7.9 | –7.7 |
| Registered electors | 3,791 | | |
| Turnout | 1,310 | 34.69 | –7.71 |
| | Liberal Democrats hold | Swing | –3.9 | |
South East Purbeck
South East Purbeck | Party | Candidate | Votes | % | ±% |
| | Liberal Democrats | Ben Wilson | 848 | 57.8 | +40.3 |
| | Conservative | Cherry Louise Brooks* | 523 | 35.7 | +5.0 |
| | Labour | Peter Copp | 95 | 6.5 | -5.2 |
| Turnout | 1,466 | 42.57 | |
| | Liberal Democrats gain from Conservative | Swing | | |
St Leonards & St Ives
St Leonards & St Ives | Party | Candidate | Votes | % | ±% |
| | Conservative | Ray Bryan* | 1,236 | 62.5 | +8.6 |
| | Conservative | Barry Peter Goringe* | 1,160 | 58.6 | +3.0 |
| | Liberal Democrats | Nicola Joanne Buskell | 730 | 36.9 | +13.6 |
| | Liberal Democrats | Andrew Paul Barham | 626 | 31.6 | New |
| Turnout | 1,979 | 30.52 | |
| | Conservative hold | Swing | | |
| | Conservative hold | Swing | | |
Stalbridge & Marnhull
Stalbridge & Marnhull | Party | Candidate | Votes | % | ±% |
| | Conservative | James Charles Vitali | 767 | 51.0 | +3.4 |
| | Liberal Democrats | Rosalind Sheila Eveleigh | 603 | 40.1 | +9.3 |
| | Green | Richard Harvey | 133 | 8.8 | New |
| Turnout | 1,503 | 34.46 | |
| | Conservative hold | Swing | | |
Stour & Allen Vale
Stour & Allen Vale | Party | Candidate | Votes | % | ±% |
| | Liberal Democrats | Will Chakawhata | 688 | 53.0 | +29.5 |
| | Conservative | Robin David Cook* | 497 | 38.3 | -5.2 |
| | Labour | Maryanne Pike | 114 | 8.8 | +2.1 |
| Turnout | 1,299 | 34.30 | |
| | Liberal Democrats gain from Conservative | Swing | | |
Sturminster Newton
Sturminster Newton | Party | Candidate | Votes | % | ±% |
| | Conservative | Carole Yvonne Jones* | 712 | 66.9 | +34.4 |
| | Liberal Democrats | Kevin Nicholas Maitland-Gleed | 267 | 25.1 | -1.3 |
| | Labour | Jennifer Daultrey | 85 | 8.0 | +3.7 |
| Turnout | 1,064 | 30.81 | |
| | Conservative hold | Swing | | |
Swanage
Swanage | Party | Candidate | Votes | % | ±% |
| | Conservative | Gary Maurice Suttle* | 1,262 | 39.7 | -6.2 |
| | Conservative | William Stanley Trite* | 1,148 | 36.2 | -7.1 |
| | Labour | Debby Monkhouse | 1,084 | 34.1 | +10.9 |
| | Labour | Chris Bradey | 789 | 24.9 | +6.7 |
| | Independent | Philip Michael Eades | 686 | 21.6 | +1.5 |
| | Independent | Helen Mary McDavid | 460 | 14.5 | New |
| | Liberal Democrats | Matt Piper | 283 | 8.9 | -5.0 |
| | Green | Kia Pope | 215 | 6.8 | New |
| | Liberal Democrats | Gill Calvin Thomas | 192 | 6.0 | -11.6 |
| Turnout | 3,175 | 40.92 | |
| | Conservative hold | Swing | | |
| | Conservative hold | Swing | | |
Upwey & Broadwey
Upwey & Broadwey | Party | Candidate | Votes | % | ±% |
| | Liberal Democrats | David James Northam | 710 | 55.9 | +14.8 |
| | Conservative | Jan Edward Ernest Bergman | 317 | 25.0 | -15.3 |
| | Labour | Byron Silver | 242 | 19.1 | +0.5 |
| Turnout | 1,269 | 34.04 | |
| | Liberal Democrats hold | Swing | | |
Verwood
Verwood | Party | Candidate | Votes | % | ±% |
| | Conservative | Simon Gibson* | 2,006 | 64.3 | +0.7 |
| | Conservative | Toni Bartley Coombs* | 1,918 | 61.5 | +2.3 |
| | Conservative | Spencer Grant Flower* | 1,765 | 56.6 | +1.3 |
| | Liberal Democrats | Lindsey Dedden | 857 | 27.5 | New |
| | Liberal Democrats | Ted Mason | 707 | 22.7 | New |
| | Liberal Democrats | Ginette Marie Holdroyd | 579 | 18.6 | +2.5 |
| | Labour | Sandra Turner | 487 | 15.6 | +9.1 |
| | UKIP | John Baxter | 220 | 7.1 | -7.1 |
| Turnout | 3,118 | 28.91 | |
| | Conservative hold | Swing | | |
| | Conservative hold | Swing | | |
| | Conservative hold | Swing | | |
Wareham
Wareham | Party | Candidate | Votes | % | ±% |
| | Liberal Democrats | Beryl Rita Ezzard* | 1,879 | 68.0 | +10.9 |
| | Liberal Democrats | Ryan David Holloway* | 1,710 | 61.8 | +21.2 |
| | Conservative | Jane Newell | 632 | 22.9 | -7.1 |
| | Conservative | Victoria Stocqueler | 617 | 22.3 | -7.0 |
| | Labour | David Brian Law | 361 | 13.1 | +1.8 |
| Turnout | 2,765 | 35.88 | -5.28 |
| | Liberal Democrats hold | Swing | 8.7 | |
| | Liberal Democrats hold | Swing | 13.9 | |
West Moors & Three Legged Cross
West Moors & Three Legged Cross | Party | Candidate | Votes | % | ±% |
| | Conservative | David Shortell* | 1,056 | 50.3 | -7.0 |
| | Conservative | Andy Skeats | 1,054 | 50.2 | -3.5 |
| | Liberal Democrats | Sally Christine Walls | 713 | 34.0 | +12.0 |
| | Liberal Democrats | Peter Durant | 671 | 32.0 | +14.5 |
| | Independent | Malcolm John Hobbs | 273 | 13.0 | New |
| | Independent | Steven Anzinger-Cooper | 239 | 11.4 | New |
| Turnout | 2,100 | 28.59 | -4.76 |
| | Conservative hold | Swing | 9.6 | |
| | Conservative hold | Swing | 9.1 | |
West Parley
West Parley | Party | Candidate | Votes | % | ±% |
| | Conservative | Andrew Charles Parry* | 564 | 66.0 | +3.5 |
| | Independent | Ann Josephine Miller | 152 | 17.8 | -2.8 |
| | Liberal Democrats | Marlies Koutstaal | 139 | 16.3 | -0.6 |
| Turnout | 855 | 28.70 | -3.4 |
| | Conservative hold | Swing | 1.9 | |
West Purbeck
West Purbeck | Party | Candidate | Votes | % | ±% |
| | Liberal Democrats | Michael John Baker | 1,245 | 52.3 | +30.8 |
| | Conservative | Laura Jane Beddow* | 962 | 40.4 | -3.7 |
| | Liberal Democrats | David Graham Civil | 929 | 39.0 | +24.5 |
| | Conservative | Peter Kendrick Wharf* | 835 | 35.1 | -6.0 |
| | Labour | Peter David Green | 300 | 12.6 | +0.8 |
| | Labour | David Peden | 171 | 7.2 | -3.9 |
| Turnout | 2,380 | 33.41 | +3.18 |
| | Liberal Democrats gain from Conservative | Swing | 17.2 | |
| | Conservative hold | Swing | 15.3 | |
Westham
Westham | Party | Candidate | Votes | % | ±% |
| | Liberal Democrats | Ryan Dean Hope* | 708 | 43.8 | -2.3 |
| | Liberal Democrats | Alex Fuhrmann | 684 | 42.3 | -0.7 |
| | Labour | Lucy Hamilton | 438 | 27.1 | +2.9 |
| | Labour | Jon Rodd | 320 | 19.8 | -2.9 |
| | Independents for Dorset | Christine Mary James | 272 | 16.8 | New |
| | Conservative | Alexander John McGlynn | 255 | 15.8 | -3.0 |
| | Conservative | Thomas Oswald Tannassee | 175 | 10.8 | -7.0 |
| Turnout | 1,618 | 24.04 | -5.57 |
| | Liberal Democrats hold | Swing | 2.3 | |
| | Liberal Democrats hold | Swing | 0.9 | |
Wimborne Minster
Wimborne Minster[7] | Party | Candidate | Votes | % | ±% |
| | Liberal Democrats | Shane Bartlett* | 1,161 | 62.3 | -3.2 |
| | Liberal Democrats | David Morgan* | 1,067 | 57.2 | -1.2 |
| | Conservative | Sue Cook | 493 | 26.4 | +0.4 |
| | Conservative | Mike Bartlett | 451 | 24.2 | -1.5 |
| | Labour | Ashley Wynne Rowlands | 283 | 15.2 | +6.0 |
| Rejected ballots | 13 | 0.69 | |
| Turnout | 1,864 | 29.76 | -6.66 |
| Registered electors | 6,307 | | |
| | Liberal Democrats hold | Swing | 2.0 | |
| | Liberal Democrats hold | Swing | 0.1 | |
Winterborne & Broadmayne
Winterborne & Broadmayne[7] | Party | Candidate | Votes | % | ±% |
| | Liberal Democrats | Roland Tarr* | 747 | 62.1 | +5.5 |
| | Conservative | Mark Penfold | 314 | 26.1 | -3.1 |
| | Reform UK | Graham Richard Brant | 142 | 11.8 | -2.4 |
| Rejected ballots | 10 | 0.82 | |
| Turnout | 1,203 | 34.81 | -6.39 |
| Registered electors | 3,490 | | |
| | Liberal Democrats hold | Swing | 4.2 | |
Winterborne North
Winterborne North [7] | Party | Candidate | Votes | % | ±% |
| | Liberal Democrats | Barrie George Cooper | 663 | 54.6 | +28.6 |
| | Conservative | Steve O'Connell | 444 | 36.6 | -3.3 |
| | Labour | Haydn White | 107 | 8.8 | +1.5 |
| Rejected ballots | 23 | 1.85 | |
| Turnout | 1,214 | 32.84 | -9.06 |
| Registered electors | 3,776 | | |
| | Liberal Democrats gain from Conservative | Swing | 15.8 | |
Yetminster
Yetminster [7] | Party | Candidate | Votes | % | ±% |
| | Liberal Democrats | Chris Kippax | 813 | 47.7 | +12.2 |
| | Conservative | Diane Elizabeth Howell | 752 | 44.1 | -8.8 |
| | Green | Stuart Martin | 139 | 8.2 | New |
| Rejected ballots | 10 | 0.58 | |
| Turnout | 1,704 | 42.08 | -1.38 |
| Registered electors | 4,073 | | |
| | Liberal Democrats gain from Conservative | Swing | 10.5 | |
References
- ^ "Dorset Council Forthcoming elections, referenda and polls". Dorset Council. Retrieved 23 October 2023.
- ^ "Election timetable in England". Department for Levelling Up, Housing & Communities. Retrieved 23 October 2023.
- ^ "Local elections: every Dorset council seat is up for grabs". Channel 4 News. 2024-04-28. Retrieved 2024-04-28.
- ^ "Dorset Council (all wards) elections on 2 May 2024", Dorset Council, 3 December 2024
- ^ Jones, Paul (20 May 2024). "New leadership revealed for Dorset Council after Lib Dems' election win". Purbeck Gazette. Retrieved 2 July 2024.
- ^ "Dorset result - Local Elections 2024". BBC News. Retrieved 2024-05-04.
- ^ a b c d e f g h Dorset Council. "Results of the Dorset Council elections on 2 May 2024".


 13
13  13
13 


