2008 UK local government election
2008 Plymouth City Council election[1] First party Second party Party Conservative Labour Last election 31 26 Seats won 14 5 Seats after 37 20 Seat change Popular vote 28,041 16,063 Percentage 47.3% 27.1%
Map showing the results of contested wards in the 2008 Plymouth City Council elections.
Council control before election Conservative
Council control after election Conservative
The 2008 Plymouth City Council election was held on 1 May 2008 to elect members of Plymouth City Council in England. One third of the council was up for election and the Conservative Party remained in control of the council with an increased majority.[2] [3]
Overall results 2008 Plymouth City Council Election Party Seats Gains Losses Net gain/loss Seats % Votes % Votes +/− Conservative 14 6 0 6 73.7 47.3 28,041 Labour 5 0 6 6 26.3 27.1 16,063 Liberal Democrats 0 0 0 0.0 13.7 8,115 UKIP 0 0 0 0.0 4.5 2,655 Green 0 0 0 0.0 4.6 2,710 Independent 0 0 0 0.0 2.0 1,173 BNP 0 0 0 0.0 1.0 571 Total 19 59,328
Note: All changes in vote share are in comparison to the corresponding 2004 election .
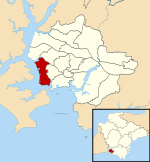
Ward results Budshead Location of Budshead ward Budshead 2008 Party Candidate Votes % Conservative Jack Thompson 1,717 53.8% Labour Chris Mavin 987 30.9% Liberal Democrats Tracy Lang 488 15.3% Majority 730 22.9% Turnout 3,192 33.9% Conservative gain from Labour
Compton Location of Compton ward Compton 2008 Party Candidate Votes % Conservative Richard Ball 1,947 57.6% Liberal Democrats Emma Swann 478 14.1% Labour Ross Burns 470 13.9% Green Josie Bannon 252 7.5% UKIP Andrew Leigh 234 6.9% Majority 1,469 43.4% Turnout 3,381 37.5% Conservative hold
Devonport Location of Devonport ward Devonport 2008 Party Candidate Votes % Labour Nicola Wildy 1,050 41.8% Conservative Betty Gray 954 38.0% Liberal Democrats Charles Earl 310 12.3% Green Colin Bannon 198 7.9% Majority 96 3.8% Turnout 2,512 27.0% Labour hold
Efford and Lipson Location of Efford and Lipson ward Efford and Lipson 2008 Party Candidate Votes % Labour Brian Vincent 1,366 44.5% Conservative Mary Orchard 1,055 34.3% Liberal Democrats Simon Hayes 387 12.6% Green Colin Trier 2,658.6% Majority 311 10.1% Turnout 3,073 32.2% Labour hold
Eggbuckland Location of Eggbuckland ward Eggbuckland 2008 Party Candidate Votes % Conservative Peter Brookshaw 1,828 47.2% Labour John Smith 861 22.2% Independent Lee Finn 682 17.6% Liberal Democrats Laura Walker 333 8.6% Green Raymond Delamare 170 4.4% Majority 967 25.0% Turnout 3,874 37.9% Conservative hold
Ham Location of Ham ward Ham 2008 Party Candidate Votes % Labour Christopher Pattison 1,207 41.3% Conservative Frederick Brimacombe 1,158 39.6% Liberal Democrats Stephen Goldthorpe 387 13.2% Green Andrew Pratt 173 5.9% Majority 49 1.7% Turnout 2,925 30.3% Labour hold
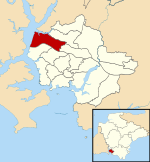
Honicknowle Location of Honicknowle ward Honicknowle 2008 Party Candidate Votes % Labour Peter Smith 1,135 41.4% Conservative Paul Rielly 935 34.1% Liberal Democrats Gillian Hirst 433 15.8% Green Nicholas Byrne 241 8.8% Majority 200 7.3% Turnout 2,744 26.9% Labour hold
Moor View Location of Moor View ward Moor View 2008 Party Candidate Votes % Conservative Edward Delbridge 1,453 43.7% Labour Paul Hutchings 1,153 34.7% Liberal Democrats David Jolly 311 9.4% UKIP Richard Barrett 297 8.9% Green Nicola Bannon 111 3.3% Majority 300 9.0% Turnout 3,325 35.8% Conservative gain from Labour
Peverell Location of Peverell ward Peverell 2008 Party Candidate Votes % Conservative Patricia Nicholson 2,036 55.1% Labour John Sewell 626 17.0% Green Don Allen 521 14.1% Liberal Democrats Deborah Earl 510 13.8% Majority 1,410 38.2% Turnout 3,693 36.9% Labour hold
Plympton Chaddlewood Location of Plympton Chaddlewood ward Plympton Chaddlewood 2008 Party Candidate Votes % Conservative David Salter 1,133 60.0% Labour Pauline Murphy 300 15.9% UKIP Jonathan Frost 233 12.3% Liberal Democrats Steve Barton 223 11.8% Majority 833 44.1% Turnout 1,889 33.8% Conservative hold
Plympton Erle Location of Plympton Erle ward Plympton Erle 2008 Party Candidate Votes % Conservative John Lock 1,499 60.4% Labour Valerie Burns 391 15.8% Liberal Democrats Wesley Rowe 347 14.0% UKIP John Roberts 243 9.8% Majority 1,108 44.7% Turnout 2,480 36.2% Conservative hold
Note: This Plympton Erle seat was won by Lock for the Liberal Democrats the previous time it was contested in 2004 , but he defected to the Conservatives in 2007.[4]
Plympton St Mary Location of Plympton St Mary ward Plympton St Mary 2008 Party Candidate Votes % Conservative Samantha Leaves 2,283 61.3% Labour Darren Jones 461 12.4% Liberal Democrats Liz Barton 385 10.3% Independent James Sanderson 304 8.2% UKIP Hugh Williams 291 7.8% Majority 1,822 48.9% Turnout 3,724 37.3% Conservative hold
Plymstock Dunstone Location of Plymstock Dunstone ward Plymstock Dunstone 2008 Party Candidate Votes % Conservative Kevin Wigens 2,300 59.2% Liberal Democrats Stephen Kearney 636 16.4% Labour Mike Fox 477 12.3% UKIP Alan Skuse 417 10.7% Independent Bruce Abbott 53 1.4% Majority 1,664 42.9% Turnout 3,883 39.8% Conservative hold
Plymstock Radford Location of Plymstock Radford ward Plymstock Radford 2008 Party Candidate Votes % Conservative Michael Leaves 1,962 54.5% Labour Julia Olsen 686 19.0% UKIP Roger Bullock 508 14.1% Liberal Democrats Steven Lemin 447 12.4% Majority 1,276 35.4% Turnout 3,603 37.3% Conservative hold
St Budeax Location of St Budeaux ward St Budeaux 2008 Party Candidate Votes % Conservative Gloria Bragg 1,003 36.5% Labour Margaret Storer 983 35.7% Liberal Democrats Ray McSweeney 559 20.3% Green Roger Creagh-Osborne 205 7.5% Majority 20 0.7% Turnout 2,750 28.7% Conservative gain from Labour
St Peter and the Waterfront Location of St Peter and the Waterfront ward St Peter and the Waterfront 2003 Party Candidate Votes % Conservative Sally Stephens 1,064 36.6% Labour Valentine Hiromeris 995 34.2% Liberal Democrats Christina MacCullie 264 9.1% BNP Michael Antonucci 233 8.0% UKIP Sean O'Kane 216 7.4% Independent Jo Jo 134 4.6% Majority 69 2.4% Turnout 2,906 30.7% Conservative gain from Labour
Southway Location of Southway ward Southway 2008 Party Candidate Votes % Conservative Peter Berrow 1,318 38.8% Labour David Weekes 1,155 34.0% Liberal Democrats Jane Barwick 583 17.2% BNP Lawrence Miller 338 10.0% Majority 163 4.8% Turnout 3,394 % Conservative gain from Labour
Stoke Location of Stoke ward Stoke 2008 Party Candidate Votes % Conservative David Reynolds 1,500 46.3% Labour David Haydon 1,014 31.3% Liberal Democrats Kirsty Barwick 382 11.8% Green Wendy Miller 347 10.7% Majority 486 15.0% Turnout 3,243 34.8% Conservative gain from Labour
Sutton and Mount Gould Location of Sutton and Mount Gould ward Sutton and Mount Gould 2003[5] Party Candidate Votes % Labour Edwin Rennie 985 36.0% Conservative Edmund Shillabeer 896 32.7% Liberal Democrats Peter York 413 15.1% Green Tean Mitchell 227 8.3% UKIP Jonquil Webber 216 7.9% Majority 89 3.3% Turnout 2,737 28.2% Labour hold
See also References ^ "Local elections: Plymouth". BBC News ^ "Local elections 2008" (PDF) . parliament.uk . ^ "Local Election Results 2008". Andrew Teale . ^ "Council defector not to quit seat". BBC News ^ "| PLYMOUTH.GOV.UK". www.plymouth.gov.uk .

 6
6  6
6 


 Council elections in Devon


