1964 Danish general election
|
| ← 1960 | 22 September 1964 | 1966 → |
|
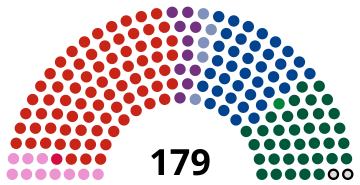
All 179 seats in the Folketing
90 seats needed for a majority |
| Turnout | 85.51% |
|---|
| Party | Leader | % | Seats | +/– | | Social Democrats | Jens Otto Krag | 41.94 | 76 | 0 | | Venstre | Erik Eriksen | 20.82 | 38 | 0 | | Conservatives | Poul Sørensen | 20.06 | 36 | +4 | | SF | Aksel Larsen | 5.76 | 10 | −1 | | Social Liberals | Karl Skytte | 5.31 | 10 | −1 | | Independents | Iver Poulsen | 2.50 | 5 | −1 | | Elected in the Faroe Islands | | Social Democratic | Peter Mohr Dam | 39.34 | 1 | 0 | | People's | Hákun Djurhuus | 29.70 | 1 | +1 | | Elected in Greenland | | Independents | – | 100 | 2 | 0 | This lists parties that won seats. See the complete results below. | Prime Minister before | Prime Minister-elect | Jens Otto Krag
Social Democrats | Jens Otto Krag
Social Democrats | |
General elections were held in Denmark on 22 September 1964.[1] The Social Democratic Party remained the largest in the Folketing, with 76 of the 179 seats. Voter turnout was 86% in Denmark proper, 50% in the Faroe Islands and 49% in Greenland.[2] They were the first elections with the new electoral threshold of 2%.
Results
 |
|---|
| Party | Votes | % | Seats | +/– |
|---|
| Denmark proper |
|---|
| Social Democrats | 1,103,667 | 41.94 | 76 | 0 |
| Venstre | 547,770 | 20.82 | 38 | 0 |
| Conservative People's Party | 527,798 | 20.06 | 36 | +4 |
| Socialist People's Party | 151,697 | 5.76 | 10 | –1 |
| Danish Social Liberal Party | 139,702 | 5.31 | 10 | –1 |
| Independent Party | 65,756 | 2.50 | 5 | –1 |
| Justice Party of Denmark | 34,258 | 1.30 | 0 | 0 |
| Communist Party of Denmark | 32,390 | 1.23 | 0 | 0 |
| Danish Unity | 9,747 | 0.37 | 0 | New |
| Schleswig Party | 9,274 | 0.35 | 0 | –1 |
| Peace Politics People's Party | 9,070 | 0.34 | 0 | New |
| Independents | 255 | 0.01 | 0 | 0 |
| Total | 2,631,384 | 100.00 | 175 | 0 |
|
| Valid votes | 2,631,384 | 99.64 | |
|---|
| Invalid/blank votes | 9,472 | 0.36 | |
|---|
| Total votes | 2,640,856 | 100.00 | |
|---|
| Registered voters/turnout | 3,088,269 | 85.51 | |
|---|
| Faroe Islands |
|---|
| Social Democratic Party | 4,133 | 39.34 | 1 | 0 |
| Union Party | 3,121 | 29.70 | 0 | –1 |
| People's Party | 2,622 | 24.95 | 1 | +1 |
| Progress Party | 631 | 6.01 | 0 | New |
| Total | 10,507 | 100.00 | 2 | 0 |
|
| Valid votes | 10,507 | 99.47 | |
|---|
| Invalid/blank votes | 56 | 0.53 | |
|---|
| Total votes | 10,563 | 100.00 | |
|---|
| Registered voters/turnout | 21,040 | 50.20 | |
|---|
| Greenland |
|---|
| Independents | 8,332 | 100.00 | 2 | 0 |
| Total | 8,332 | 100.00 | 2 | 0 |
|
| Valid votes | 8,332 | 98.85 | |
|---|
| Invalid/blank votes | 97 | 1.15 | |
|---|
| Total votes | 8,429 | 100.00 | |
|---|
| Registered voters/turnout | 17,238 | 48.90 | |
|---|
| Source: Nohlen & Stöver |
References
- ^ Dieter Nohlen & Philip Stöver (2010) Elections in Europe: A data handbook, p524 ISBN 978-3-8329-5609-7
- ^ Nohlen & Stöver, pp542-543


